


Hi folks! Long time no see!
I've been quite busy with maps. Still working on some commissions for Mutant Chronicles, along with some other games. Here is an early venus.
venus.png

Hi folks! Long time no see!
I've been quite busy with maps. Still working on some commissions for Mutant Chronicles, along with some other games. Here is an early venus.
venus.png
"That sounds... incredibly complicated, but there's no doubt the result is fantastic." /Diamond


Why wouldn't you just use a Venus height map and fill in the low regions with water and then figure everything from there? Or do they want something else and just randomly named it Venus for no reason?
I have to admit, I didn't thought about that. And I can totally understand - it's a random map with the name Venus.Originally Posted by Durakken

But, I have worked out the map from a text with descriptions about the archipelago, the crater, the Mountains, the three climate zones, so according to the text, it's accurate, but according to venus, it's not. I shall look into this and see if I can move the forest and the Mountains around, and eventually redraw the coastline making it look more like real venus.
"That sounds... incredibly complicated, but there's no doubt the result is fantastic." /Diamond
Durakken to each there own ...
i few years back i reworked the Venus Magellan radar data
reduced down the full res data to a massive 131072 x 65536 reflectance and a 65536x32768 height topographic map
the first thing that sticks out is the polar ice !
( i might not be a "river police" ?? maybe BUT i am a polar ice one )
It looks like this map is 75.3 north to 75.3 south Mercator ( approx.1220x791)
with some non mapping "ice" added at the poles
remapped 90 north to 0 north polar-stereographic ( from Mercator )
Last edited by johnvanvliet; 11-19-2015 at 10:54 PM.
--- 90 seconds to Midnight ---
--------
--- Penguin power!!! ---
Awesome, now in English? (Or Swedish preferably!) I'm not a Tech-mapper and I don't know if what you are writing is positive or negative! but please explain, I'm open for all kind of feedback!
"That sounds... incredibly complicated, but there's no doubt the result is fantastic." /Diamond
I'm not John, but I'll try to rephrase what he wrote...
It is not obvious what "projection" you intended to be using for your map. In particular, whether or not your map goes all the way to the poles. When a map does include a planet's poles, people usually draw a map which is called "equirectangular", with degrees of longitude drawn the same size as degrees of latitude. Such a map winds up being twice as wide as it is tall. Here's what your map would look like in that case (overlayed with lines of latitude and longitude separated by 10 degrees).
tmp4.jpg
Maps which do not include the poles, are usually drawn using the "Mercator" projection.When using a Mercator projection, the lines of equal latitude are stretched apart more and more in the areas close to the poles. These maps often are used in primary and secondary schools when teaching children geography and history, since the Earth's poles have been relatively unimportant until recently. If your map is a Mercator projection, here's what it looks like with lines of longitude and latitude separated by 10 degrees:
tmp3.jpg
If you want to map a Mercator projection onto a sphere, though, you do need to include the polar areas. The equivalent equirectangular map would look like this:
tmp2g.jpg
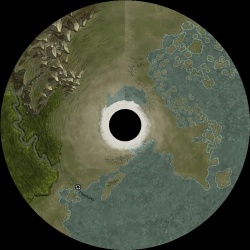
A problem with polar regions is that Mercator and equirectangular maps stretch them across the entire width of the map. As a result, hand-drawn features which look reasonable on a flat map get squeezed together when drawn on a sphere. They often look more like streaks pointing away from the pole. This is often called a "polar pinch". Here's what the south pole looks like using your map if you intended it to include the poles, with and without the long/lat grid:
capture_26112015_085645.pngcapture_26112015_084224.png
Finally, here's what the south pole looks like if your map is a Mercator projection, not including poles. The streaks are less pronounced, but we can't know what the geography might be like in the polar regions.
capture_26112015_084317.png
One way to get the polar features to look reasonable when mapped onto a sphere is to draw separate maps of them as if you were looking straight down at the poles and then to use a re-projection utility to merge those maps with a equirectangular map of the rest of the planet. Personally, I like to use MMPS project (a command-line program) to do the re-projection but there are many others.
Disclaimer:
In case it isn't obvious, I (and John, too, perhaps) like to use Celestia to build imaginary solar systems using maps drawn by members of the forum. As a result, being able to see the poles is relatively important. There are many other programs available for visualizing and traveling among planetary systems in 3D. Orbiter and Space Engine are two examples.
Selden
Ah, Venus! One of those worlds where you don't have to worry much about plate tectonics.
banner.jpg
I don't know anything about tectonics so can't comment on that (though I feel fairly confident that Venus doesn't have forests and greenery!!)
Just wanted to say that this is looking really nice and you're off to a great start. I *love* those cliffs to the left. I'll be watching with interest as you develop this.
"We are the music makers, and we are the dreamers of dreams"
I once started something similar, if you want to see what it might look like just by filling in a height map. Johnvanvliet has a great heightmap. I know, because I used it.
Last edited by acrosome; 11-20-2015 at 09:36 AM.
 Posting Permissions

 Reply With Quote


